
 |
| Chart of The Day |
OCTOBER: This is one of the peculiarly dangerous months to speculate in stocks in. The other are July, January, September, April, November, May, March, June, December, August, and February, Mark Twain
There are two times in a man's life when he should not speculate: when he can't afford it and when he can, Mark Twain
Tradition technical analysis, a discipline full of moving averages, stochastics, relative strength, chart patterns, and volume, is largely inconsistent and opinion driven. Bull and bears attempt to enter the trend through interpretation that's as much opinion (art form) as discipline (experience and skill). Successful trading/investing focuses solely on discipline through the study of price, volume, and time. Price, volume, and time define the message of the market.
Chart
Subscriber Comments
Keep it simple
Smart money goes long secondary and primary upside alignment. The key to profit-taking and/or consolidation is TIME. Upside and downside alignment follows the cycle of TIME reported in the Matrix and Trading Notes.
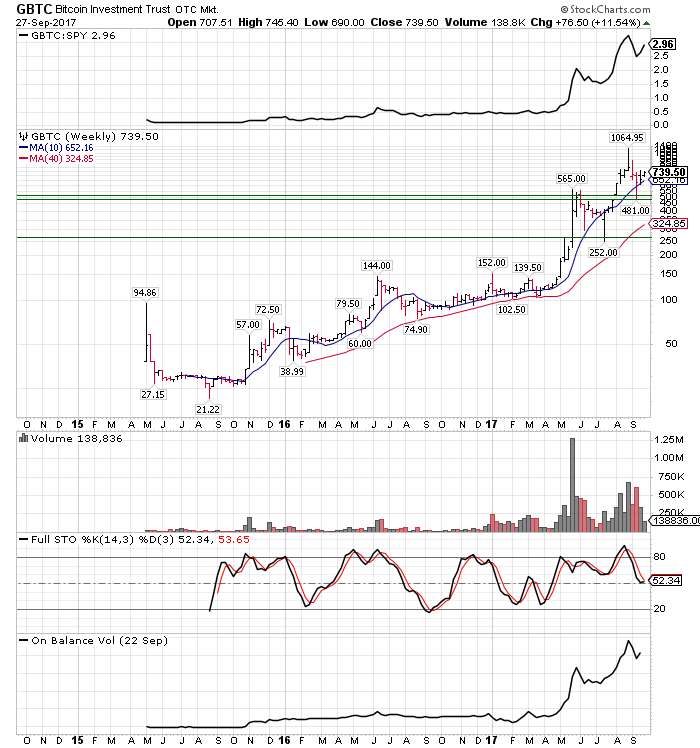
GBTC's study of TIME:
Secondary Trend: BuST = 1.4
Primary Trend: BuST = N/A due to short trading history.
Secondary Trend

Primary Trend

----------------------------------
Market-driven money flow, trend, and intermarket analysis is provided by an Insights key.

